Brand tracking: important to do, often important to ignore. The very act of tracking should encourage us to think about the longer term, the implications of our marketing; it makes us more accountable. At the same time the results can make us dangerously short-termist, desperate to move the needle every month, panic and over-react when it doesn’t. Bad for the health of the brand and for the health of the brand manager.
Asking less and asking it less often can be surprisingly helpful. Take a long-term view in the way you should for share portfolios: hold for years and, crises aside, don’t look at the prices more often than quarterly as you’ll feel the pain of drops more than you’ll enjoy the equivalent gains.
Fame x Availability
So less often is sound advice, but what should you measure? Expressed simply, market share is a function of Fame and Availability.
- Fame is the emotional pull and warmth a brand has, how does it make people feel? If they feel nothing….they’ll buy nothing from you. We quantify this with our FaceTrace® measure and translate the emotional profile of each brand into an Emotion-into-Action™ score and corresponding 1 to 5 star rating.
- Availability can be more functional, reflecting things like distribution, but it’s also about mental availability– how salient is the brand (how quickly and easily does it come to mind under time pressure), how available is it perceived to be? For example, Asda has less than half as many stores as Sainsbury’s yet scores better on “readily available” – Asda stores tend to be bigger, easier to park at and Asda have spent significantly more on advertising in recent years.
At BrainJuicer we’ve been monitoring the fame – the “System 1” emotional health - of many UK brands for 6 years now for our own interest. Taking an annual view of the intuitive measures that matter most lets us pull out the signal from the noise. Of the 67 brands tested this year, 5-star Amazon topped the UK chart for the first time. It’s so good at making life easier, literally delivering on its promise, that people are willing to turn a blind eye to bad press and tax scandals. Such is the power of reciprocity and emotional credit! While it excels at Fame (the vertical axis on Figure 1), Amazon has room for more Availability (horizontal axis), lagging scores from more established brands like Walkers and Cadbury. I could get something – just about anything – from Amazon tomorrow but I could be holding a bar of Dairy Milk within minutes. Can Amazon get even quicker (and profitably so) to sate human impatience? Is there (whisper it quietly) room for offline expansion?
Figure 1: 2014 Fame and Availability in the UK
*Emotion-into-Action™ score
**% associating the brand with “Readily Available” under time pressure
In stark contrast to 5-star Amazon is Tesco, highly available but tumbling to a 2-star emotional low this year, well off its 4-star peak of 2009-2010. Morrisons has also experienced a drop in fame and both retailers have suffered market share losses in recent years. The Fame / Availability imbalance for Tesco and Morrisons suggests that if fame doesn’t improve, a reduction in the number of stores may follow for the imbalance to be redressed. Highly unappealing but it has precedence (Tesco closed 500 stores in the late 1970s) and Goldman Sachs are suggesting that the biggest UK supermarket brands could have to shut 1 in 5 stores to improve profitability.
Extra share of voice for market share gain
Though unlikely to be the sole reason for the decline, Tesco’s advertising spend in 2013 was relatively low and may well be the reason in part for their 2014 drop in fame. Their share of voice was about 10 points behind their market share, making for a negative “Extra share of voice” (ESOV). ESOV is a useful long-term measure to consider as it’s predictive of market share growth. A model espoused by Peter Field and Les Binet in their analysis of IPA effectiveness data, ESOV explains very convincingly the market share changes among retailers over the last year, as Figure 2 below demonstrates.
Figure 2: Long-term ESOV is correlated with market share growth
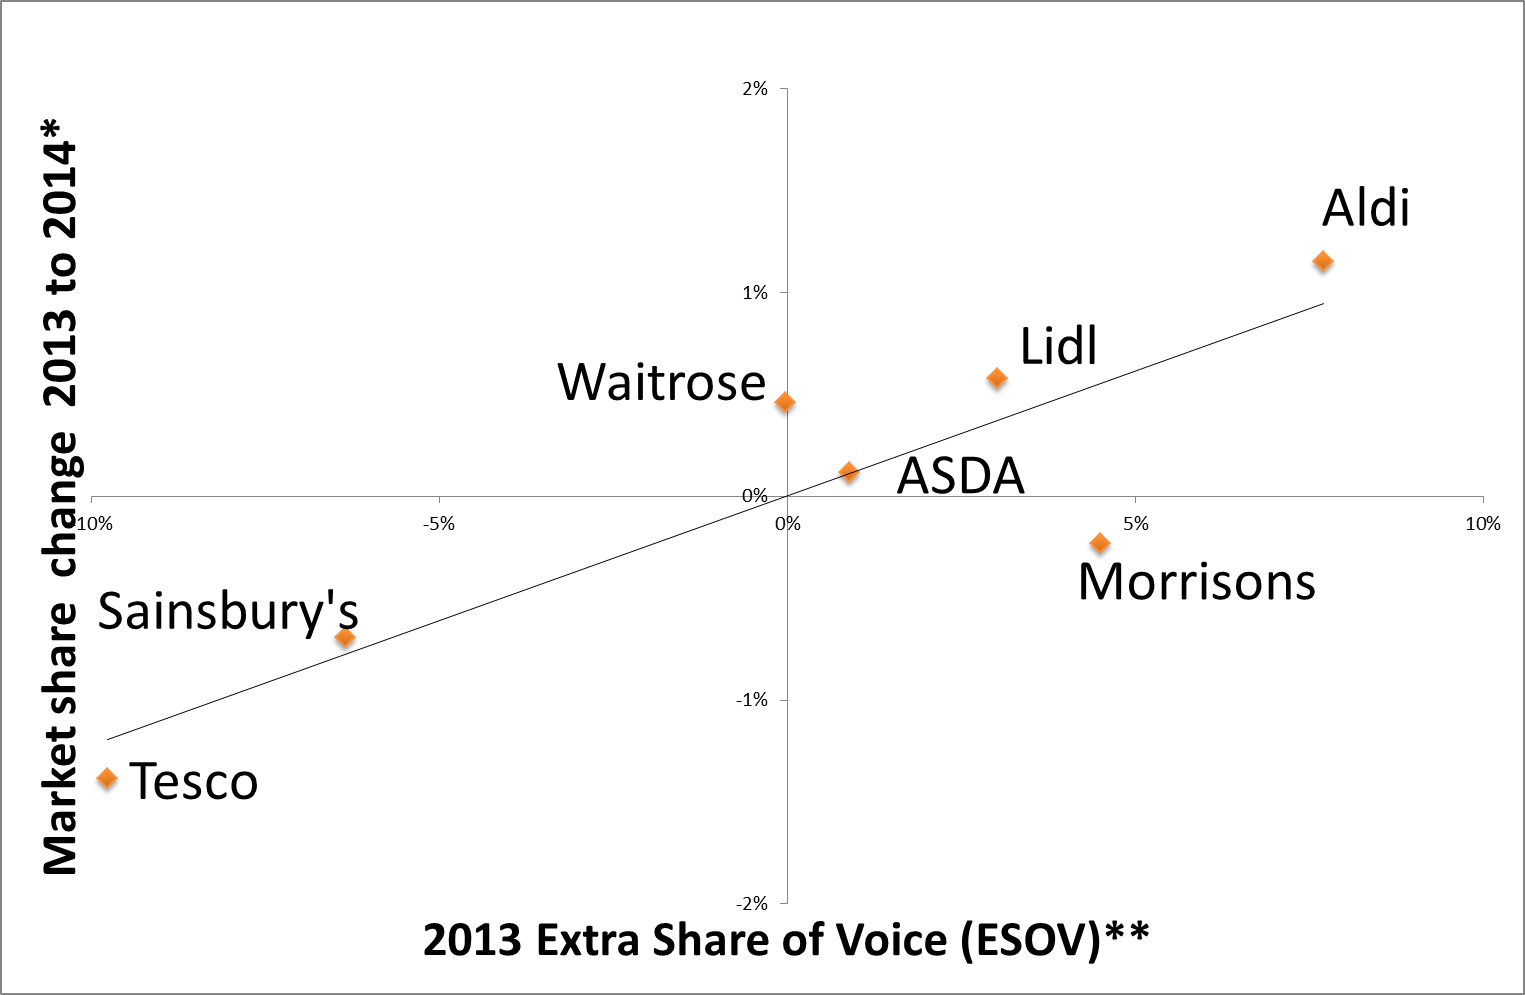
*Value market share from Kantar Worldpanel percentaged for displayed brands, 12 we 12th October 2014 vs 12 we 13th October 2013.
**2013 advertising spend reported by Nielsen Ad Dynamix, percentaged across displayed brands minus 2013 Worldpanel market share as above.
We don’t expect Tesco’s recovery to be rapid – BP have taken 4 years to regain pre Deepwater Horizon disaster levels of emotion and banks such as RBS are still rebuilding after the recession – but fame-building advertising should be part of the solution – and in plentiful measure.
If you’d like to see how people felt about your brand’s fame and availability in 2014, contact us at www.brainjuicer.com, and we can take you through the full report.
Read more from Brainjuicer in our Clubhouse.